
After years of shrinking, Miami Valley, Ohio’s ID’d Jewish population plateaus
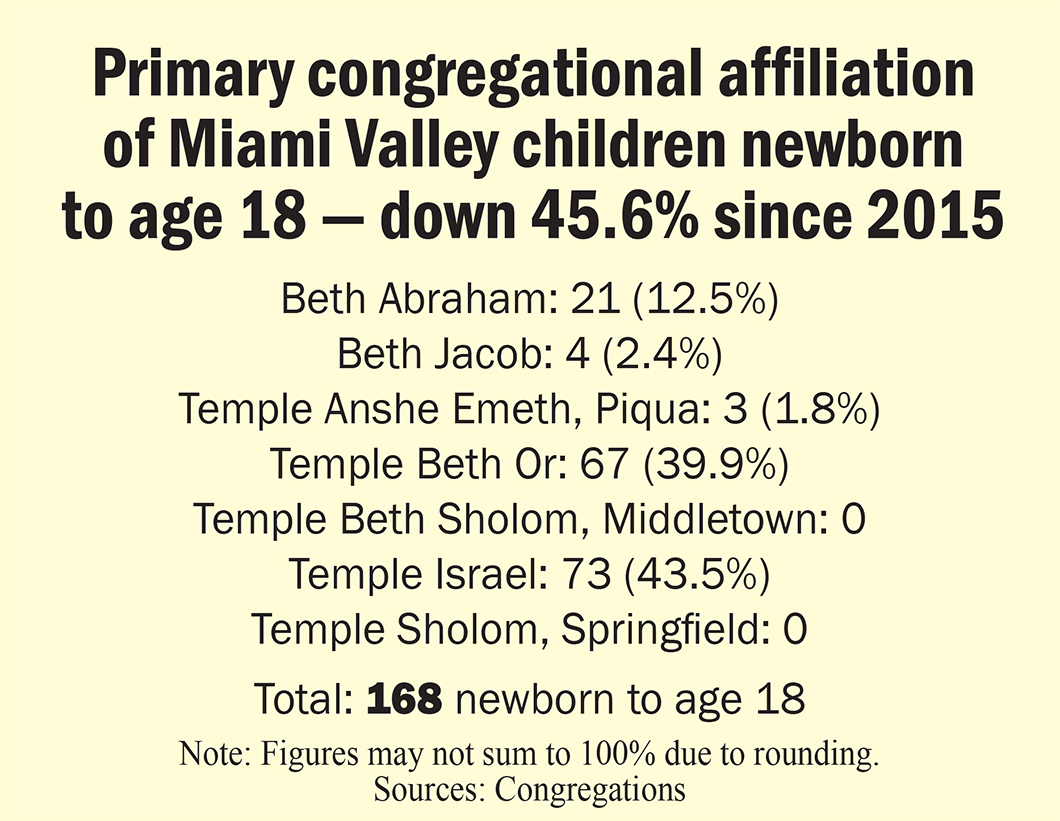
But number of children with area Jewish congregations down by 45.6% since 2015
By Marshall Weiss, The Dayton Jewish Observer
Based on data from the Jewish Federation of Greater Dayton, the identified Jewish households and population across the Miami Valley have hit plateaus after decades of shrinking.
The Observer’s analysis of the Jewish Federation’s database puts the number of identified Jewish households in the Miami Valley at 1,534, a slight increase of 2.8% from 2015. The number of identified Jews in the Miami Valley is 2,641, a slight decrease of 2.9% since 2015.
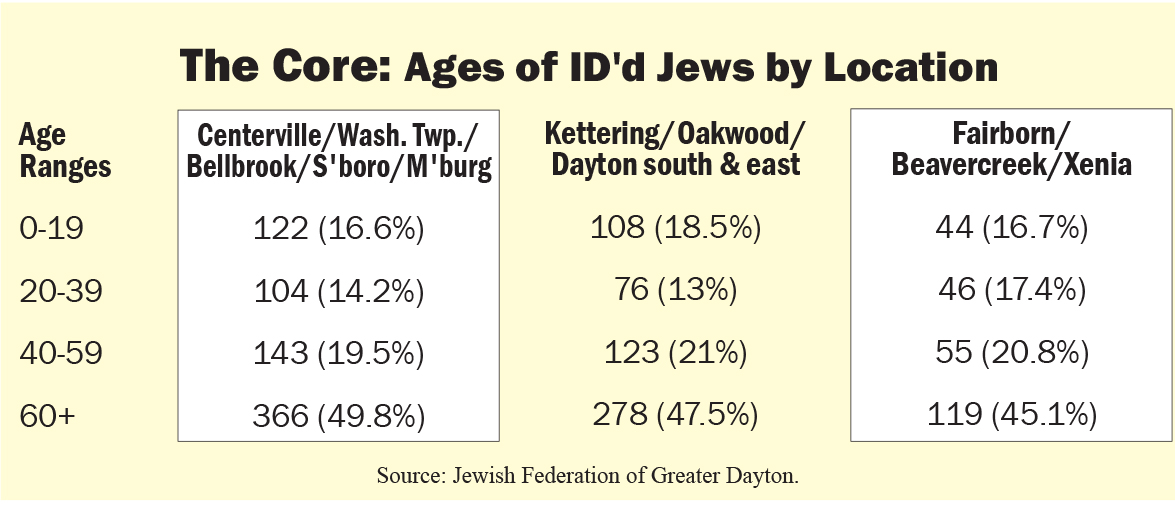
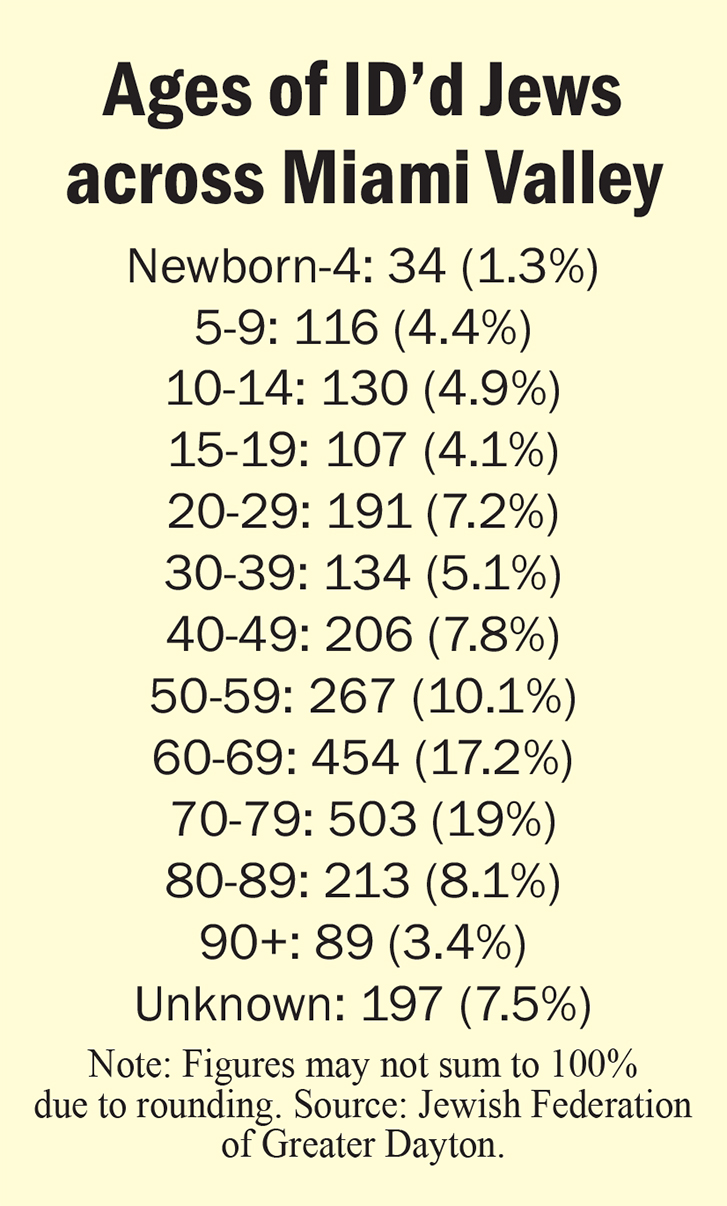
The number of children ages newborn through 19 on the Federation’s database, down only six from 2015, is now 387, 14.7% of the current total identified Jewish population.
Those age 60 and up on the list comprise 1,259 people, 47.7% of the known population, which, according to Ira Sheskin — director of the Jewish Demography Project of the Miller Center for Contemporary Judaic Studies at the University of Miami — shows more about those who choose to connect with the organized Jewish community than the actual number of Jews in the Miami Valley.
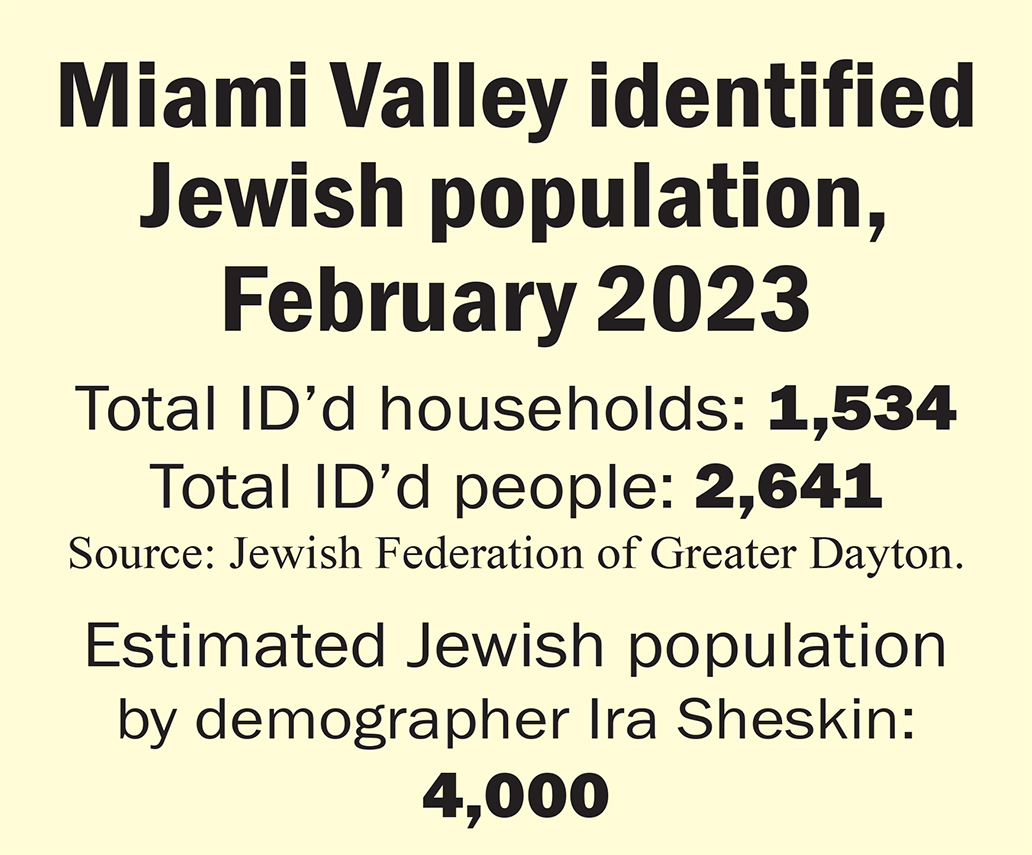
As in 2015, Sheskin estimates the total Jewish population of the Miami Valley at 4,000, about a third more than we know of.
Since 2006, Sheskin has served as editor of The American Jewish Yearbook. He helped The Observer analyze the Federation’s list in 2015 as he now has in 2023.
“There are a lot of households not even on the Federation list,” he says.
In 2015, the Miami Valley’s identified Jewish population had declined by more than half over the previous 20 years.
The causes at the time were younger Jews who began leaving the Miami Valley in the wake of the recession of 2008, and elderly Jews moving or passing away.
Here are key findings of The Observer’s analysis of the Federation’s database.
Identified Jews live in 77 Zip Codes across the Miami Valley.
But in only four Zip Codes are the number of Jewish households and Jewish people above 4.2% of the identified Jewish totals in the Miami Valley. Those four are:
• 45429: 169 households (11%), 268 people (10.1%)
• 45459: 166 households (10.8%), 273 people (10.3%)
• 45458: 153 households (10%), 325 people (12.3%)
• 45419: 135 households (8.8%), 292 people (11.1%)
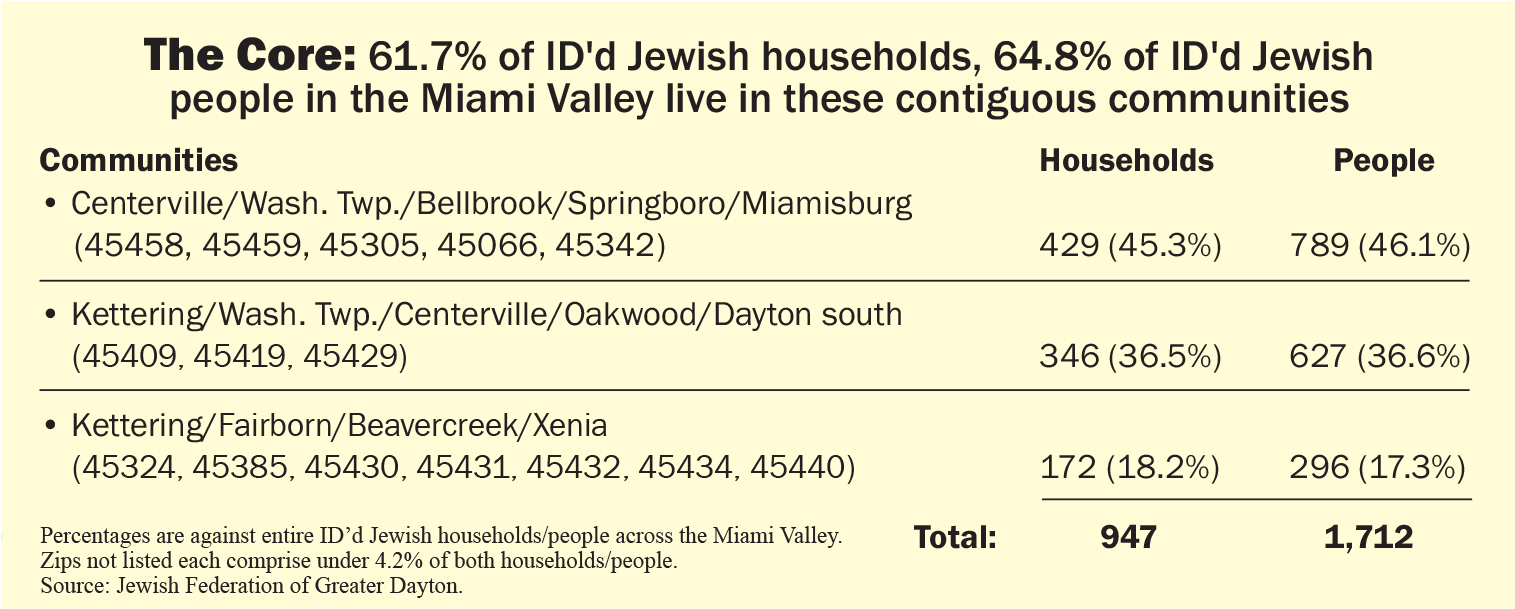
A core of households & population follows I-675 from south to east.
A solid majority of the Miami Valley’s known Jewish community now lives along I-675, from Springboro to Xenia. This is in addition to the already established core running from Oakwood through Kettering, Centerville, and Washington Township. This contiguous, now expanded core is home to 61.7% of ID’d Jewish households and 64.8% of ID’d Jewish people in the Miami Valley.
The core is growing.
Since 2015, the number of ID’d Jewish households in this expanded core has increased by 15.2%; the number of known Jewish people in the core is up 7.2%.
Beavercreek and Fairborn now comprise 10% of ID’d Jewish households and people in the Miami Valley. That’s because of an increase in ID’d Jewish households of 50% and an increase in ID’d Jews of 42% in Beavercreek and Fairborn since 2015.
Miamisburg is now home to 41 ID’d Jewish households with 62 people, increases of 28.1% and 31.9% respectively since 2015.
Xenia and Springboro have held steady with slight increases since 2015: Xenia is home to 18 ID’d Jewish households with 32 Jews, and Springboro has 52 ID’d Jewish households with 97 Jews.
So too has Bellbrook, with 17 ID’d Jewish households and 32 Jews.
A deeper dive into the core:
• 70.8% of known Jewish children in the Miami Valley (newborn-19) live in the core.
• 69.5% of ID’d Jewish adults ages 20-39 live in the core.
• The largest concentration of children (newborn-19) in the core is in Centerville/Washington Township Zip Codes 45458 and 45459, with 93 children, 35.9%.
Pockets of community across the region achieve some growth.
Since 2015, areas that have had modest increases in known Jewish population are Tipp City (21 households, 36 people), Yellow Springs (35 households, 59 people), and Springfield (29 households, 61 people). Downtown Dayton, 45402, comprises 29 households and 48 people.
Shrinking areas are still a presence.
A generation ago, the majority of the Miami Valley’s Jewish community lived in the suburbs northwest of Dayton. Though these population centers have shrunk significantly, pockets remain in Englewood (53 households, 87 people), Vandalia (19 households, 30 people), Dayton 45405 (30 households, 37 people), and Dayton 45415 (65 households, 96 people). Combined, these areas comprise 167 households, 10.9% of ID’d Miami Valley Jewish households; and 250 people, 9.5% of the ID’d Miami Valley Jewish population.
Declines at Jewish congregations reflect the national trend.
The Miami Valley’s synagogues and temples provided The Observer with data that indicate shrinking memberships and numbers of children, which demographer Ira Sheskin says is in line with national trends he sees.
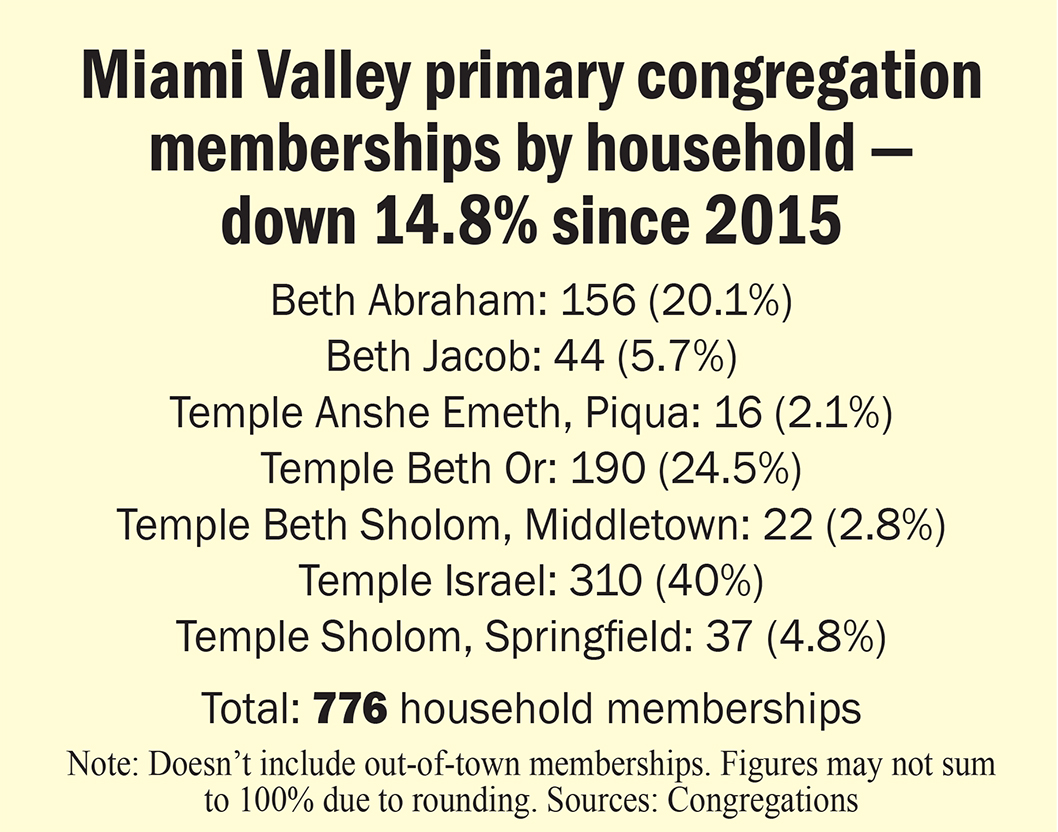
The total number of Miami Valley primary congregation memberships by household is down 14.8% since 2015, from 911 household memberships to 776. This represents 50.6% of the number of Miami Valley households on the Federation list.
Within these congregations, the number of children (newborn-18) has decreased 45.6% since 2015, from 309 to 168. This is about 44% of the number of Miami Valley ID’d Jewish children on the Federation list.
Sheskin points out that the number of U.S. Jews who are affiliated with a Jewish congregation is 35 percent, according to the Pew Research Center’s Jewish Americans 2020 study, and that number has remained steady over the past 30 years.
“Everybody thinks that the percentage of households with synagogue members is way down, that numbers used to be really higher,” he says. “It turns out that since 1990, it really hasn’t changed.”
In combination with that figure, the Jewish birthrate in the U.S. has dropped according to Pew.
“Something that is clearly happening is that the number of children in the Jewish community is down because the number of children that Jewish women are having is down in a pretty significant way,” Sheskin explains.
“Basically, the age at first marriage in the United States — both Jews and non-Jews — has gone up in a significant way. My parents’ generation, people got married out of high school. My generation, I’m 72, people got married more often out of college. And today, people are waiting until they are well out of college before they get married.”
He says that since people get married later, they have fewer children.
“The average number of children that Jews are having today in the United States is 1.5 children each. And it’s 1.7 for all Americans. For a population to replace itself from shrinking, it’s 2.1. Fertility among Orthodox Jews nationwide is quite high, 3.3 children.”
According to Pew, the birthrate for Jewish women in the United States who aren’t Orthodox is 1.4 children each. Sheskin says this significantly impacts synagogue membership.
“That’s one of the reasons I think you have fewer people belonging to synagogues. Because people tend to join when they have kids. And if you have fewer kids, you belong for a shorter period of time. You have fewer kids in the (religious) school.”
More congregants are Reform.
Data provided by the Miami Valley’s Jewish congregations show the Reform movement’s expanding reach here, albeit with fewer total children.
Currently, 74.1% of primary local congregational memberships are with the Reform movement. That’s up from 68% in 2015. And 84% of children (newborn to 18) whose families are primary members of local Jewish congregations are affiliated with the Reform movement, up from 78.3% in 2015.
According to Pew’s 2020 report, 37% of U.S. Jews identify as Reform, 17% as Conservative, 9% as Orthodox, 4% as another branch, and 32% as no particular branch.
Hillel Academy & Chabad.
Adding to the contours of the Miami Valley’s Jewish community is Hillel Academy Jewish day school, with 43 students enrolled from kindergarten through grade six, twice the number of students enrolled there when the school moved from Harrison Township to Oakwood a dozen years ago.
Chabad of Greater Dayton, which, like all Chabad centers, does not have a membership model, notes that 268 households participated either through programs or donations in 2022, and that there are 114 children in those households.
Sheskin says that 38% of U.S. Jews participated in programming with Chabad last year, according to Pew.
“What’s interesting here, 10% of the (U.S.) Chabad participants are Jews of no religion. Of the 90% of Jews of religion who go to Chabad, a quarter are Orthodox, a quarter are Conservative, a quarter are Reform, and a quarter are just Jewish.”
Editor’s notes
• You’ll see the term “identified Jews” frequently in this article. This is intentional. When it comes to analyzing the Jewish Federation database, it’s key to remember we’re not talking about every Jew or every Jewish household in the Miami Valley. We’re talking about those our organized local Jewish community has identified. This article only refers to the entire Miami Valley Jewish community with demographer Ira Sheskin’s estimate that it likely encompasses a third more people than we know of.
• Zip Codes sometimes overlap municipalities. I’ve done my best to identify all within each Zip Code I mention. If I’ve missed any, please let me know.
• With the Jewish Federation database, I looked at youths from newborn to age 19. With congregations, I looked at newborns to age 18.
• My special thanks go to Jewish Federation’s database guru, Sheila Myers, for pulling together the information for this article, and to our congregations, Chabad, and Hillel Academy for participating once again.
To read the complete March 2023 Dayton Jewish Observer, click here.
